Stock performance Query - Quickly answer “What usually happens next?” using real historical data.
Type any stock ticker and instantly see how the stock has performed after similar historical setups across 25+ different metrics and multiple timeframes.
This powerful query tool scans the stock’s entire history, finds every past instance that matches your current setup, and delivers clear statistical probabilities and outcomes for the next day, week, month, and quarter.
What You Get:
Historical performance across daily, weekly, monthly, quarterly, and custom date ranges
Win rates (% of time the stock closed green) for each timeframe
Average return, best-case, and worst-case outcomes
Maximum Favorable Excursion (MFE) and Maximum Adverse Excursion (MAE)
Weighted averages that give more importance to setups with larger sample sizes
Frequent Dates analysis — shows which historical dates appeared most often across all queries
Clean, easy-to-read layout with 5 specialized Query sheets
How It Works: Enter a ticker (example: AAPL). The tool automatically analyzes the most recent move and runs deep historical queries. It tells you:
How the stock performed after similar +5% days in the past
Win rate and average return for the next day / week / month / quarter
Risk levels (how far it typically pulled back) and reward potential
Bottom Line: Instead of guessing whether a setup is good, you get instant, data-backed statistical evidence. The Stock Performance Query turns historical precedent into a real trading edge — helping you validate ideas, manage risk better, and make higher-probability decisions with confidence.
Best Used With: Watchlist Summary + Industry Strength Rankings for maximum edge.

 Image 1 of 6
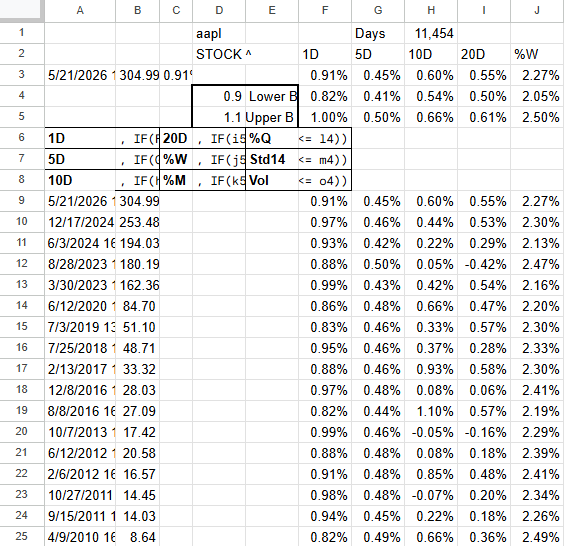 Image 2 of 6
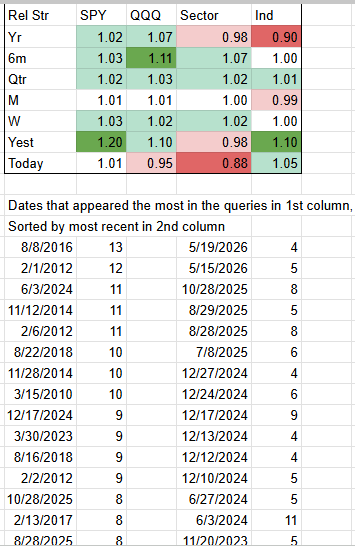 Image 3 of 6
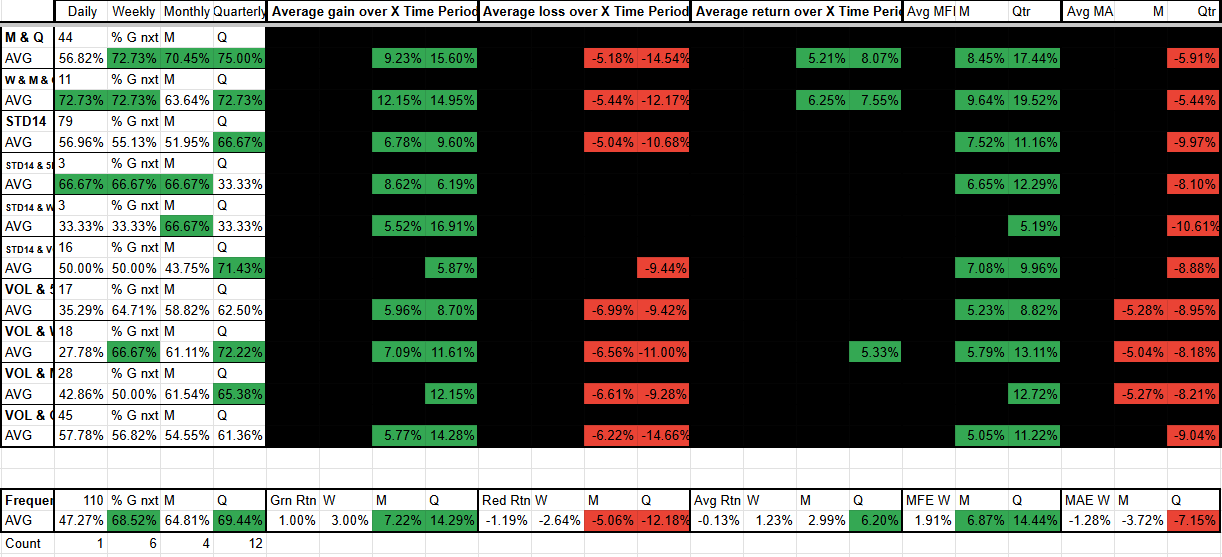 Image 4 of 6
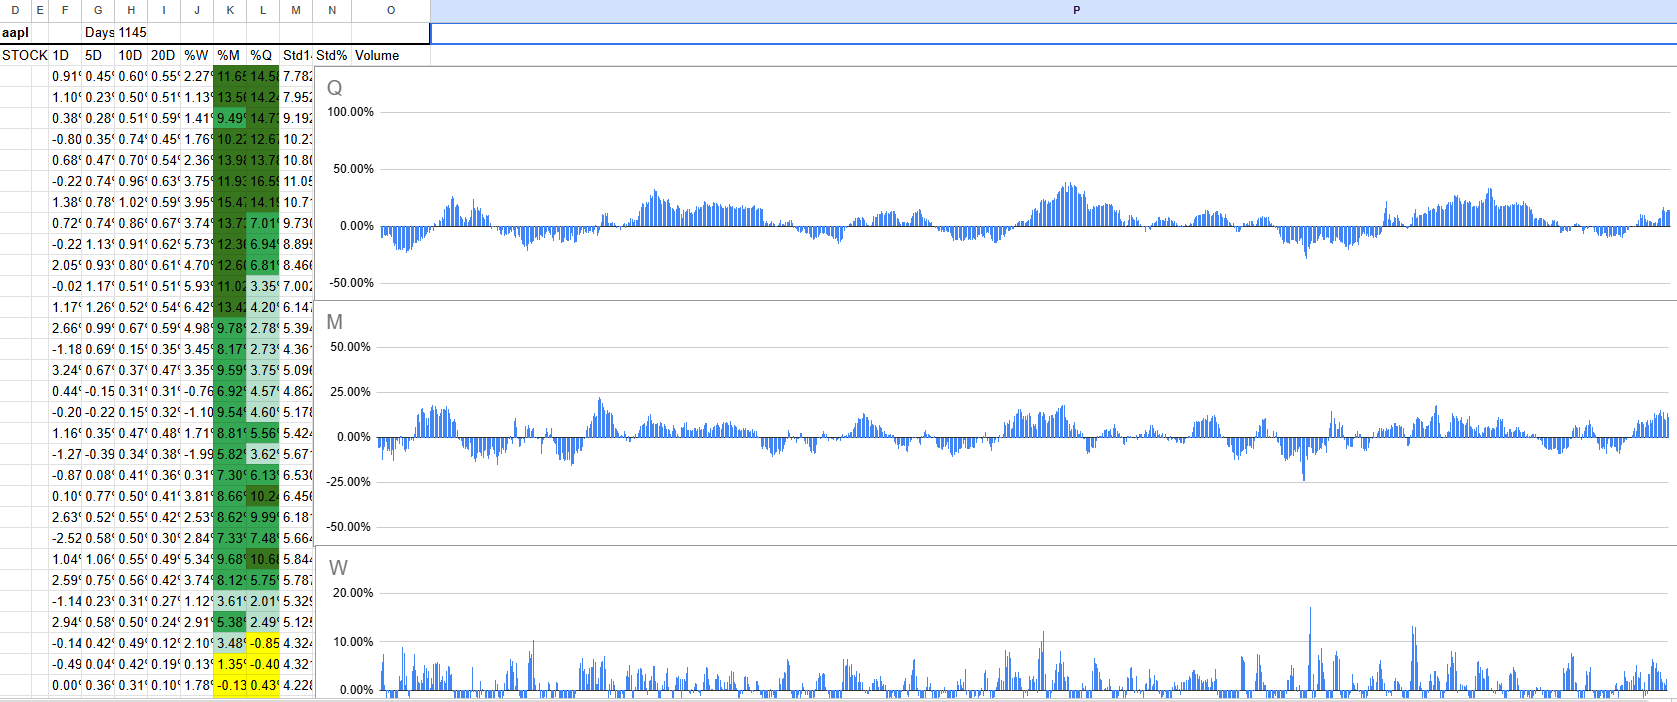 Image 5 of 6
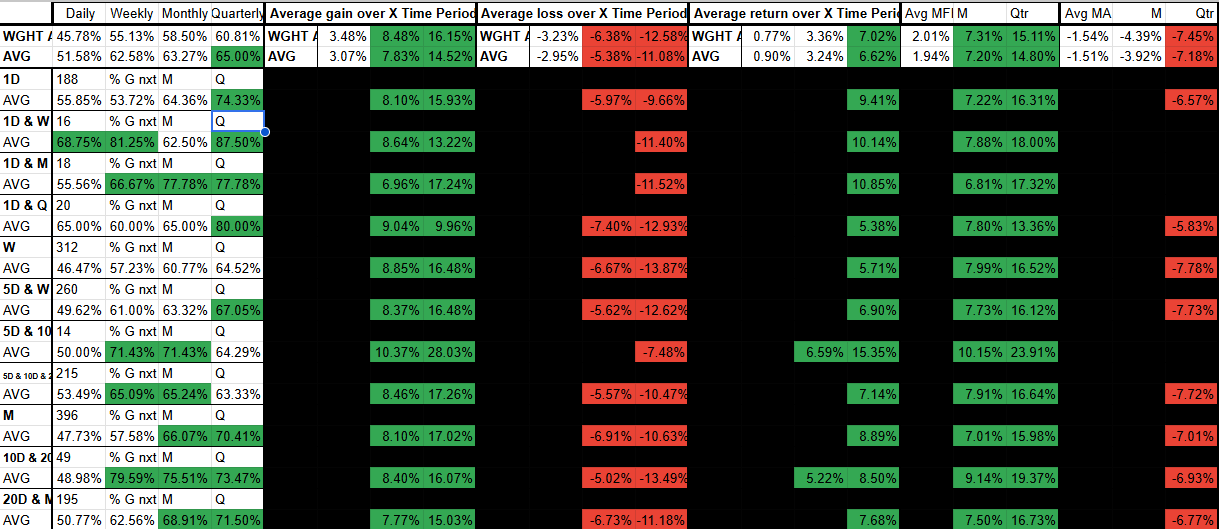 Image 6 of 6